
By the end of this lesson, young investors will:
Understand the Purpose of Technical Analysis: Learn why technical analysis is a vital tool for interpreting market behavior.
Recognize Key Chart Types: Identify and interpret common chart formats like line charts, bar charts, and candlestick charts.
Learn Fundamental Concepts: Grasp the significance of trends, support, resistance, and volume in technical analysis.
Apply Basic Indicators: Explore simple yet powerful tools like moving averages and RSI (Relative Strength Index).
Imagine you’re learning to surf. Before catching a wave, you need to read the water—observe its movements, anticipate swells, and identify patterns. Trading is no different. While fundamental analysis examines the “why” behind price movements (earnings reports, economic factors), technical analysis focuses on the “what”—what the price and volume data reveal about market behavior.
Technical analysis helps investors decode price charts, uncover trends, and make data-driven decisions. Think of it as the art of predicting the market’s next move by reading its past actions. Whether you’re a day trader or a long-term investor, mastering this skill will make you a more informed participant in the market.
Technical analysis is the study of historical price and volume data to forecast future price movements. Its foundation rests on three key principles:
Prices Reflect Everything: Market prices incorporate all relevant information, including fundamentals, news, and investor sentiment.
Prices Move in Trends: Markets don’t move randomly; they follow identifiable trends over time.
History Tends to Repeat Itself: Human behavior is consistent, and patterns observed in the past are likely to recur.
Before diving into complex analyses, let’s start with the basics: understanding price charts.
Line Charts
A line chart connects a series of closing prices over a specific period.
Strengths: Simple, easy to read, great for identifying long-term trends.
Limitations: Doesn’t provide detailed information about price fluctuations during the day.
Bar Charts
Bar charts offer more detail, displaying the open, high, low, and close (OHLC) for each time interval.
How to Read:
The top of the bar = highest price.
The bottom of the bar = lowest price.
The horizontal dash on the left = opening price.
The horizontal dash on the right = closing price.
Strengths: Provides a comprehensive snapshot of market activity.
Candlestick Charts
Candlestick charts, one of the most popular formats, are similar to bar charts but visually more engaging.
How to Read:
A filled candle (red/black) indicates a closing price lower than the opening price.
A hollow candle (white/green) indicates a closing price higher than the opening price.
The “wick” or “shadow” shows the high and low prices.
Strengths: Offers an intuitive, easy-to-read format for analyzing price action.
Trends: The Market’s Direction
A trend is the general direction in which a market or stock is moving.
Uptrend: A series of higher highs and higher lows, signaling bullish sentiment.
Downtrend: A series of lower highs and lower lows, indicating bearish sentiment.
Sideways Trend: Prices move within a range, often signaling indecision.
Support and Resistance: The Market’s Boundaries
Support: A price level where demand is strong enough to prevent further declines.
Resistance: A price level where selling pressure halts upward movements.
Support and resistance levels often serve as decision points for traders, indicating where price reversals or breakouts may occur.
Volume: The Market’s Voice
Volume represents the number of shares traded during a given period.
High volume during a price increase = strong buying interest.
High volume during a price decrease = strong selling interest.
Low volume = lack of conviction in the price move.
Volume confirms trends and can signal potential reversals or breakouts.
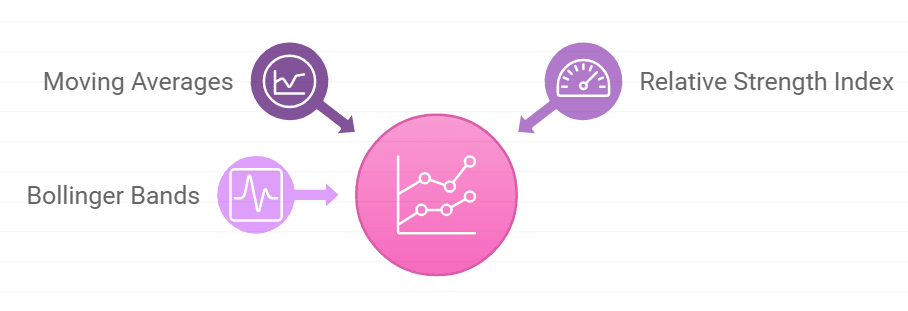
Indicators are tools derived from price and volume data, offering insights into market trends and momentum.
Moving Averages: Smoothing the Noise
A moving average calculates the average price over a specific period, helping to identify trends.
Simple Moving Average (SMA): A straightforward average of prices.
Exponential Moving Average (EMA): Gives more weight to recent prices, making it more responsive.
How to Use: When a shorter-term MA crosses above a longer-term MA, it signals a potential uptrend (golden cross). The reverse indicates a downtrend (death cross).
Relative Strength Index (RSI): Gauging Overbought or Oversold Conditions
RSI measures the speed and change of price movements, oscillating between 0 and 100.
Above 70: Overbought (potentially overvalued).
Below 30: Oversold (potentially undervalued).
How to Use: RSI can signal potential reversals when it enters overbought or oversold territory.
Bollinger Bands: Measuring Volatility
Bollinger Bands consist of a moving average and two standard deviation lines above and below it.
How to Use: When prices touch the upper band, the market might be overbought. When they touch the lower band, it might be oversold.
Technical analysis is most effective when multiple tools and techniques align to confirm a trend or signal. For instance:
A breakout above resistance with high volume confirms a potential uptrend.
RSI showing overbought conditions alongside a resistance level suggests a potential reversal.
Find the price chart of a stock you’re interested in. Answer these questions:
What trend is the stock following (uptrend, downtrend, or sideways)?
Identify the nearest support and resistance levels.
Look at the RSI and volume—what do they indicate about the stock’s momentum?
Document your observations and assess whether the stock presents a potential buying or selling opportunity.
Technical analysis is like learning a new language—the language of price charts and market behavior. By understanding trends, support and resistance, and basic indicators, you’re developing the skills to interpret the market’s story.
Remember, charts aren’t crystal balls—they don’t guarantee outcomes. Instead, they’re tools to enhance your decision-making by providing context and clarity.
In the next lesson, Chart Patterns and What They Tell You About the Market, we’ll dive deeper into recognizing specific patterns that reveal market psychology, from head-and-shoulders formations to triangles and flags. These patterns will empower you to anticipate market moves with greater confidence.
As you practice decoding charts, keep a curious and disciplined mindset. The more you observe, analyze, and learn, the more proficient you’ll become in navigating the markets. Your journey into the fascinating world of technical analysis has just begun!
